- Published on
Predicting Bitcoin Price using LSTM
Predicting time series quantities has been an interesting domain in predictive analytics. Many traditional Quantitative forecasting methods like ARIMA, SES or SMA are time tested and widely used for things like predicting stock prices.
With the amount of data we have around, neural networks make a good candidate for time-series forecasting that can outshine traditional statistical methods.
Over the past few years, we had many new neural network architectures like CNN, RNN, and LSTM making inroads into Deep Learning. Of these, LSTM's seems a suitable one for Time series forecasting.
What's an LSTM?
“Simply put, LSTM’s (Long Short Term Memory) is a type of neural network that is capable of persisting a certain amount of past data that it can use for making future predictions”
LSTM’s are developed to tackle the Vanishing and Exploding Gradient problems during Backpropagation in the RNN’s.
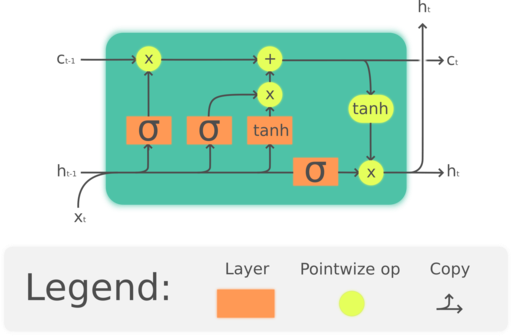
A typical LSTM unit is composed of a cell, an input gate, an output gate and a forget gate. The cell remembers values over arbitrary time intervals and the three gates regulate the flow of information into and out of the cell.
The three gates can be used to decide the amount of previous data that an LSTM cell can persist.
Check out this excellent blog on LSTM to get an intuitive idea about LSTM's.
Bitcoin Data
For building the LSTM model, I have chosen Bitcoin historical pricing dataset available on Kaggle, which is updated frequently.
It can be downloaded from Kaggle.
The dataset has Bitcoin price data from Coinbase and Bitstamp. We will be using Bitstamp data to train the model.
EDA & Preparing Data
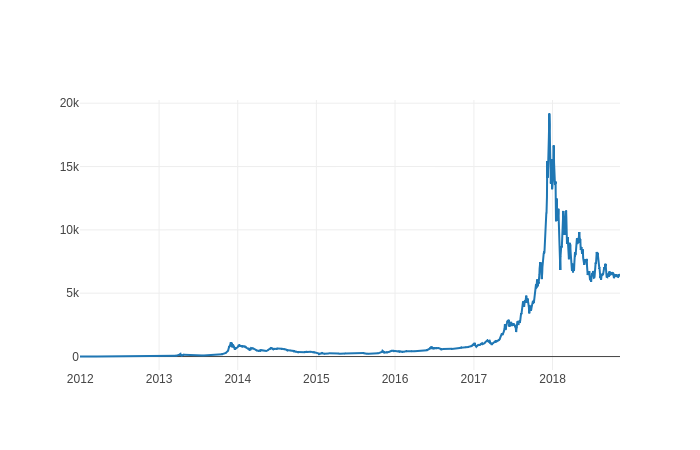
The Bitstamp dataset has data from a time period of Jan 2012 to November 2018, with the minute to minute updates of OHLC (Open, High, Low, Close), Volume in BTC and indicated currency and weighted bitcoin price.
I am using “Weighted_Price” data for this entire blog. Let’s visualize the data using Plotly. Here we can see a spike in the price in the Bitcoin during late 2017 - early 2018. The data seems accurate to the actual price.
Now, we will split the data into train and test sets. Since this a time-series data, we need to split the data using a time-frame. We would be selecting the last 365 days of the dataset as a test set and the remaining data as a train set.
Building Model
We will be using Keras to build the LSTM model. I will be using Bi-directional LSTM, which can persist data from the future as well as the past to make predictions.
To train the LSTM, we need to present the model with the price of the current date as well as past few days. These time steps are called step size or window size. Step size can affect the performance of the LSTM model.
We will use this split function to prepare the data for LSTM.
Let's prepare data for training the model.
Training LSTM
Now that we have the training data, let’s train the model. I have chosen 200 epochs for a quick test. Depending on the machine you are training, we can increase the epochs accordingly.
Results ?
Let's look at the test results the model was able to predict. We will use the plot to compare our actual test prices vs predicted prices.
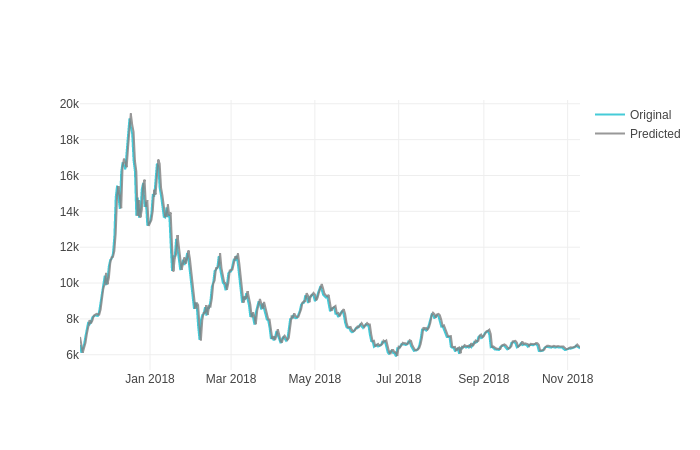
This is looking good! Let's look at the predictions in detail.
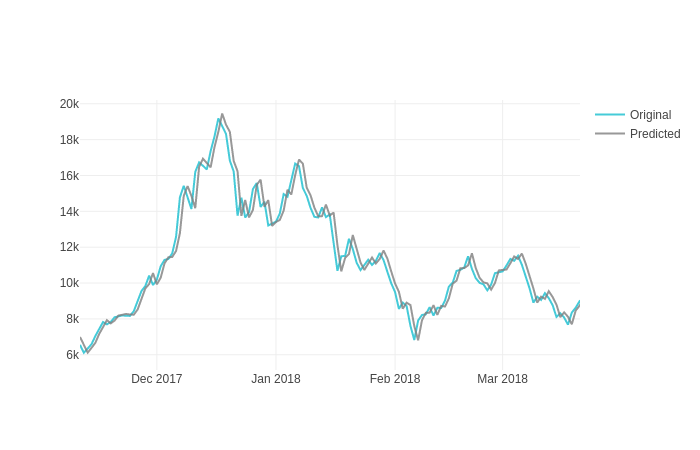
If we have a closer look at the predicted price, the model was able to match the actual test price up to some extent, but with a lag. As we are using a single feature (weighted price) to train the LSTM model, the model might not be precisely accurate at predicting the price.
This seems a good baseline model for time-series forecasting. By adding additional features and playing with the step size, we can improve the accuracy of the model further.
The complete code for this blog can be downloaded from my Github repo